The Analytics dashboard
What each number on the Analytics page means, how the period works, and which parts open up on the Starter and Growth plans.
On this page 9
Analytics shows what your WhatsApp messages bring in and what they cost, for the whole store. For the detail of one flow or one campaign, open its report from Top flows and campaigns.
The period
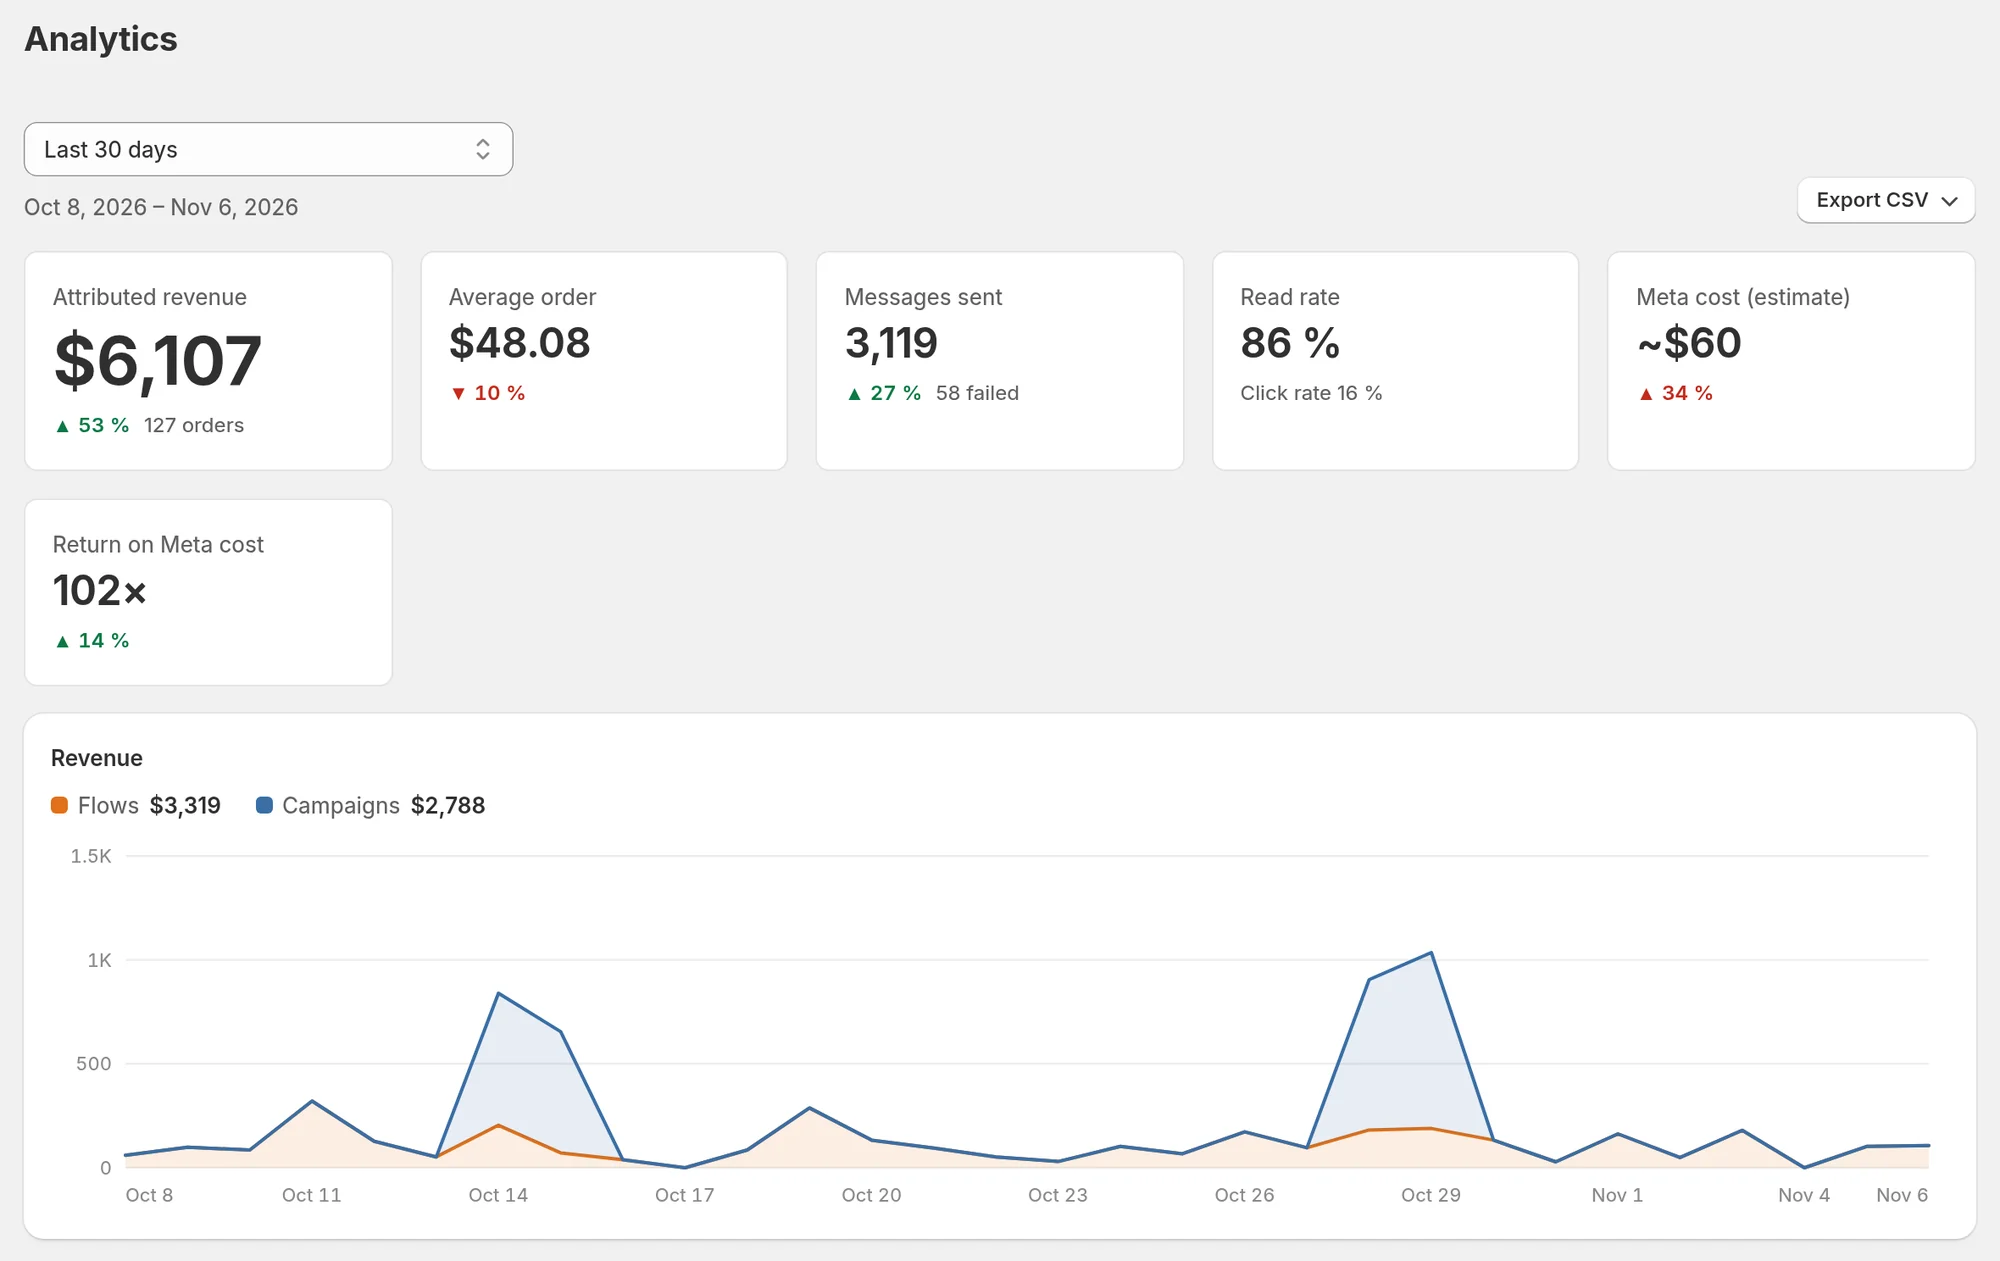
Choose the period at the top left: Last 7 days, Last 30 days (the default), Last 90 days, Last 6 months or Last 12 months. On the Growth and Pro plans, Custom range lets you pick any dates.
How far back you can go depends on your plan. Longer periods are shown greyed out with higher plan.
| Plan | History you can view |
|---|---|
| Free | 30 days |
| Starter | 90 days |
| Growth | 183 days |
| Pro | 396 days |
Days follow your store's time zone. Over 92 days, charts group the results by week.
Each tile compares the period with the one just before it, of the same length. Hover the percentage to see vs previous period.
The tiles
| Tile | What it counts |
|---|---|
| Attributed revenue | The total of the orders credited to your flows and campaigns, with the number of orders below. How orders are credited |
| Average order | Attributed revenue divided by the number of attributed orders |
| Messages sent | Every message Piaflo sent in the period: flows, campaigns, replies from the inbox and test messages. Below: how many failed |
| Read rate | Messages read out of messages delivered. Below, Click rate: tracked links clicked out of messages delivered |
| Meta cost (estimate) | What Meta should bill you for these messages, in US dollars. How it is estimated |
| Return on Meta cost | Attributed revenue divided by the Meta cost. Starter plan and above |
A click counts once per link, the first time it is opened. When there is nothing to divide by, a rate stays empty.
Messages you send from the WhatsApp Business app on your phone are left out of these numbers.
Revenue
The chart shows attributed revenue per day (or per week), with flows and campaigns stacked in two colors.
Funnel
From the Starter plan. The funnel follows your messages through five steps: Sent, Delivered, Read, Clicked, Orders. Hover a bar to see its share of the first step, and read the share of the previous step next to it. The biggest drop shows where to work: delivery, the first lines of the message, or the offer behind the link.
Top flows and campaigns
Your 10 flows and campaigns with the most attributed revenue in the period, with their number of orders. Click one to open its report. Order update flows such as order confirmation are listed with no revenue: orders are never credited to them.
Subscribers
WhatsApp subscribers, New subscribers and Unsubscribed over the period, and a chart of new subscribers per day. See Opt-in results.
Attributed orders
The last 8 orders credited in the period, with the order number (a link to the order in Shopify), the date, the flow or campaign it is credited to (From), how it was credited (Attribution: Link click or Message read) and the amount.
Subscriber cohorts and export
The page ends with Subscriber cohorts, unlocked on the Growth and Pro plans. On these plans the Export CSV button also appears at the top right. See Subscriber cohorts and CSV export.
What each plan shows
| Free | Starter | Growth | Pro | |
|---|---|---|---|---|
| Tiles, revenue chart, top flows, subscribers, attributed orders | Yes | Yes | Yes | Yes |
| Return on Meta cost, funnel | Yes | Yes | Yes | |
| Subscriber cohorts | 6 months | 12 months | ||
| Custom range, CSV export | Yes | Yes |
Locked sections show a blurred example with the plan they need. They never show your real figures. See the plans.
 Still stuck? Write to us with the flow name or the order number involved.