Subscriber cohorts and CSV export
Follow each month's new WhatsApp subscribers and see how many of them buy in the months that follow. Export your analytics as CSV files for your own reports.
On this page 3
Both features are on the Growth and Pro plans, at the bottom and top of Analytics. On lower plans they show a blurred example and the plan they need.
Subscriber cohorts
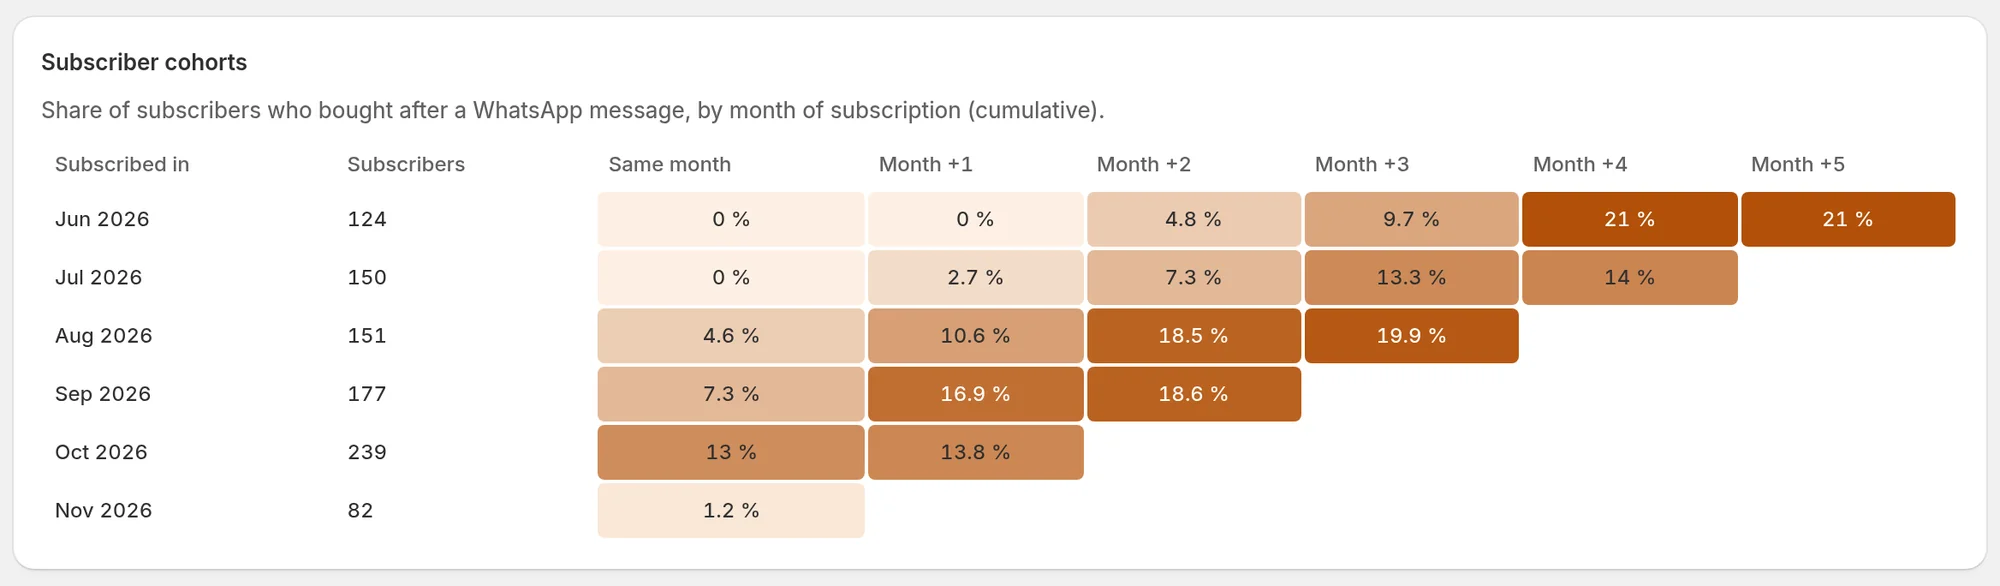
A cohort is the group of customers who subscribed to your WhatsApp messages in the same month. The table follows each group over the next months and shows the share of them who bought after a WhatsApp message.
Read the table
- Subscribed in: the month the customers subscribed.
- Subscribers: how many customers subscribed that month.
- Same month, Month +1, Month +2 and so on: the share of that cohort who had bought by the end of that month. The numbers add up from left to right: a customer who buys in Same month is still counted in Month +1, and is counted only once even if they buy again.
- Hover a cell to also see the revenue per subscriber up to that month.
- The darker the cell, the higher the share.
Growth shows the last 6 months, Pro the last 12. The most recent months have fewer columns, since fewer months have passed.
What counts as a purchase
Only the orders Piaflo attributed to a flow or a campaign: a tracked link clicked, or a message read in the 24 hours before the order. Orders a subscriber places without acting on a message do not appear. The attribution rules.
A customer belongs to the month of their latest subscription. If they unsubscribe and subscribe again later, they move to the newer month.
What to do with it
- Compare rows. When one month's subscribers buy more than another's, look at what changed that month: where they subscribed, your popup incentive, your welcome flow.
- Watch Same month: it shows how many new subscribers buy in the month they subscribed.
Export CSV
Click Export CSV at the top right of Analytics and choose one of four files. Each export covers the period selected on the page.
| Export | One row per | Columns |
|---|---|---|
| Daily results | Day | day, entered, sent, delivered, read, clicked, replied, opt_outs, failed, orders, revenue, meta_cost_usd |
| Flows | Flow | flow, status, trigger, then the same totals for the period |
| Campaigns | Campaign started in the period, or not started yet | campaign, status, started_at, recipients, excluded, then the campaign's totals since it started |
| Attributed orders | Attributed order | date, order, amount, currency, source, name, attribution |
What some columns mean:
- entered: customers who entered a flow.
- replied: first replies from customers after a flow or campaign message, within 72 hours of it.
- opt_outs: customers who replied STOP within 7 days of a flow or campaign message.
- meta_cost_usd: the estimated Meta cost, in US dollars. How it is estimated.
- attribution:
clickfor a tracked link,readfor a message read.
The file is named after the export and the dates, for example piaflo-daily-2026-10-01-2026-10-31.csv. It is encoded so that Excel opens it with accents intact.
If the download fails, Piaflo shows Export failed, try again.
Custom range
On the same plans, Custom range in the period picker lets you choose any From and To dates, then Apply. The cohorts are not affected: they always show the last 6 or 12 months.
 Still stuck? Write to us with the flow name or the order number involved.